Data:
Country: UK
Period: Yearly data from 2010 to 2022.
Cause of Death Data
The data used in this analysis is the number of deaths that occurred in England and Wales between 2010 and
2022, by underlying cause code (ICD-10), sex, and age group (up to 90+). The source is the UK Office for
National Statistics (ONS). The direct links to the mortality data by cause for 2010 to 2021 and 2022 are listed
below:
Link to the ONS 2022 data source:
Death occurrences by sex, five year age group and underlying cause (ICD-10 code) England and Wales: 2022
Link to the ONS 2010-2021 data source:
Death occurrences by sex, five year age group and underlying cause (ICD-10 code) England and Wales: 2010-2021
UK Monthly Registered Deaths (All cause)
Deaths registered monthly in England and Wales
Information regarding ONS cause of death statistics:
-
When analysing the ONS data for cause of death we noticed that there are discrepancies between the number
of deaths which have a cause of death and the number of registered deaths for a year. This is particularly the
case for deaths in 2022 (the most recent year) and younger individuals where there are significant discrepancies
between both these datasets.
-
To estimate the trends in death rates for different causes, we use Adjusted Deaths (Adj-deaths)
which refers to the deaths from a particular cause or range of causes adjusted by the ratio of registered deaths to deaths by all causes.
pease refer to the full report above, for more detailed information.
Disability Claims
For investigating the changes in disability claims, we use data from the Personal Independence Payment (PIP)
system of the Department of Work and Pensions (DWP). We analyse changes in PIP clearances for new claims
to the system, as explained in our previous analysis,
published on our website.
Summary
In this study we investigate the UK trends in death rates and disabilities for diseases of the cardiovascular system for individuals aged 15 to 44. We compute excess death rates and excess disability claims, which are the difference between observed deaths/disability rates and a given baseline for expected death/disability rates.
We measure changes in the behaviour of morbidity and mortality before the Covid-19 pandemic with the post-pandemic period for diseases of the cardiovascular system. We show a large increase in morbidity (disabilities) and mortality due to diseases of the cardiovascular from 2021. The increase in disability claims is consistent with the increase in excess deaths, and both are highly statistically significant (black swan events). The results indicate that from 2021 a novel phenomenon leading to increased cardiovascular deaths and disabilities appears to be present in individuals aged 15 to 44 in the UK.
Death and Disability Rates for Cardiovascular Diseases for ages 15-44
In this study we investigate the UK trends in death rates and disabilities for diseases of the cardiovascular system for individuals aged 15 to 44. We compute excess death rates and excess disability claims, which are the difference between observed deaths/disability rates and a given baseline for expected death/disability rates.
Adjusted Death Rates and Deaths from Cardiovascular Diseases
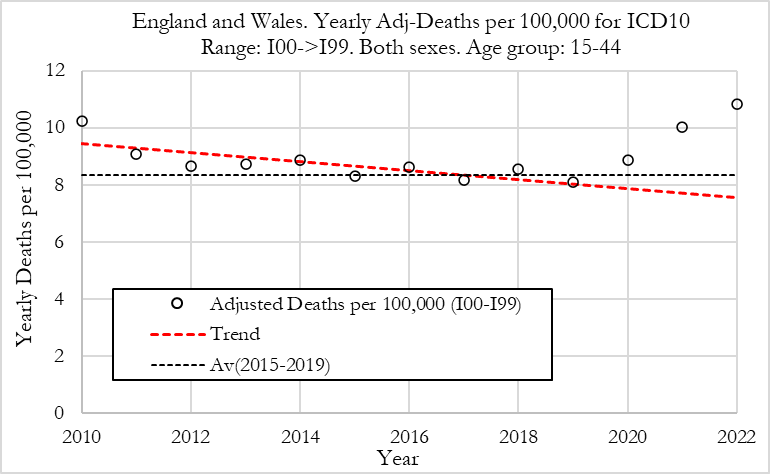
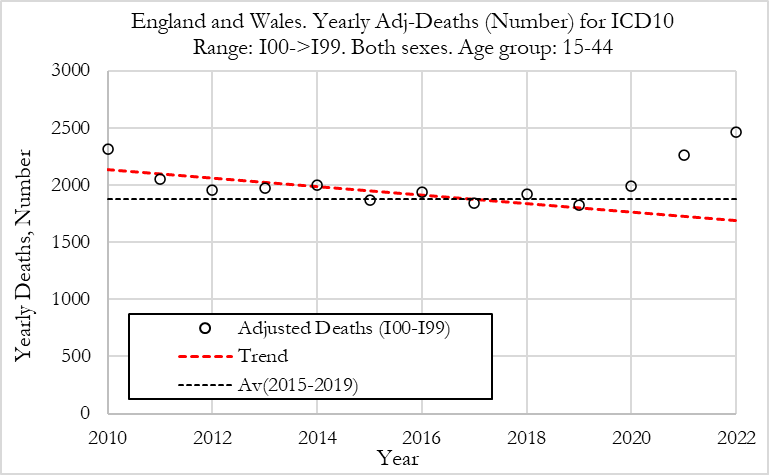
The Figures below show yearly adjusted deaths for diseases of the circulatory system (Cardiovascular) in England and Wales. The red dashed line shows the average from 2010 to 2019. The dotted line shows the 2015-2019 average death rate. Left: Adj-Deaths per 100,000. Right: Adj-Deaths (number).
Summary:
-
We can observe that deaths per year from cardiovascular diseases have been trending lower from 2010 to 2019, with a significant downward slope. In 2010 the deaths rate was 10 per 100,000, in 2019 it was around 8 per 100,000, a 20% drop.
-
The death rate increased in 2020 to about 9 per 100,000 and then again in 2021 to 10 per 100,000. In 2022 the death rate increased again to about 11 per 100,000, a level that is 10% higher than observed in 2010. The death rate in 2022 was about 3 deaths per 100,000, higher than the 2015-2019 average.
-
When translating these numbers into the absolute number of deaths for diseases of the circulatory system, shown in Figure (right), we can observe that the 5-year average deaths from 2015 to 2019 was about 1800 deaths. In 2020, cardiovascular deaths were about 2,000, 200 more than the prior 5-year average. In 2021 there were about 2300 deaths (500 more than the 2015-2019 average) and in 2022, 2500 (700 more than the 2015-2019 average).
Disability PIP Clearances for new Claims from Cardiovascular Diseases
The analysis we present here refers to clearances from new claims to the system. It should be noted that clearances refer to decisions made, which can be positive or negative. The fraction of positive clearances (that lead to a grant allowance) is shown to be stable over time at a rate of about 40%.
On our website, we present the analysis of trends in PIP clearances for the different body systems which include interactive charts where the user/researcher can change body system, age of the individuals and trend metric.
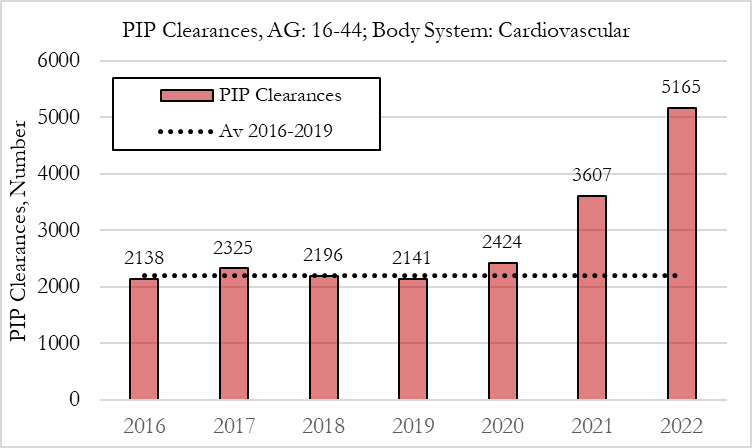
The figure shows yearly clearances for new claims to the Personal Independence Payment (PIP) system in the UK for the cardiovascular system for ages 16 to 44. The dotted line refers to the 2016 to 2019 average yearly number of new claims.
Summary:
-
When we compute the yearly PIP clearances from new claims for the cardiovascular system, shown in the figure, we observe that PIP clearances were very stable from 2016-2019, at around 2100 per year.
-
we can observe that the 5-year average absolute number of disabilities from 2015 to 2019 was about 2100. In 2020, cardiovascular disability claims were about 2200, 100 more than the prior 5-year average. In 2021, there were about 3600 disability claims (1500 more than the 2015-2019 average) and in 2022, 5100 (3000 more than the 2015-2019 average).
Analysis of Excess Death and Disability Rates for Cardiovascular Diseases for ages 15-44
In this section we investigate the trends in excess deaths from diseases of the circulatory system (cardiovascular diseases), with ICD10 codes ranging from I00 to I99, in England and Wales, for the 15-44 age group. We also compare excess deaths for males and females and compute excess disability claims.
Analysis of Excess Adjusted Death Rates from Cardiovascular Diseases
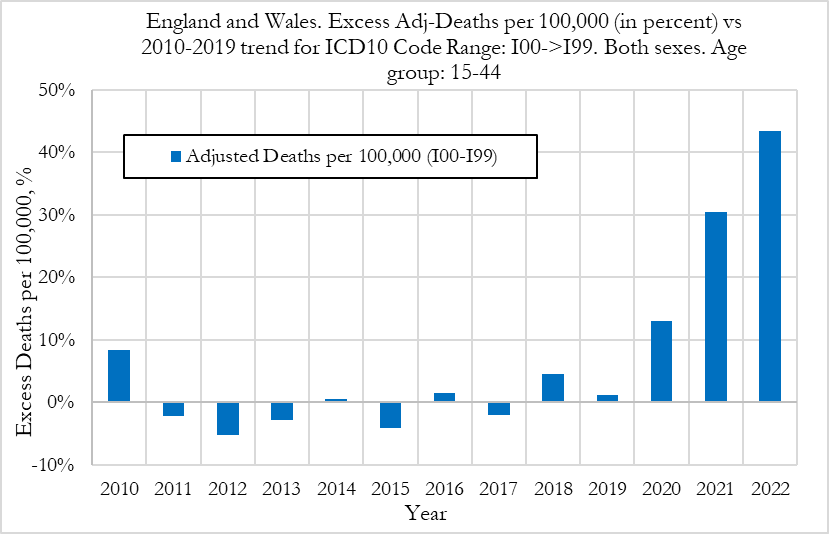
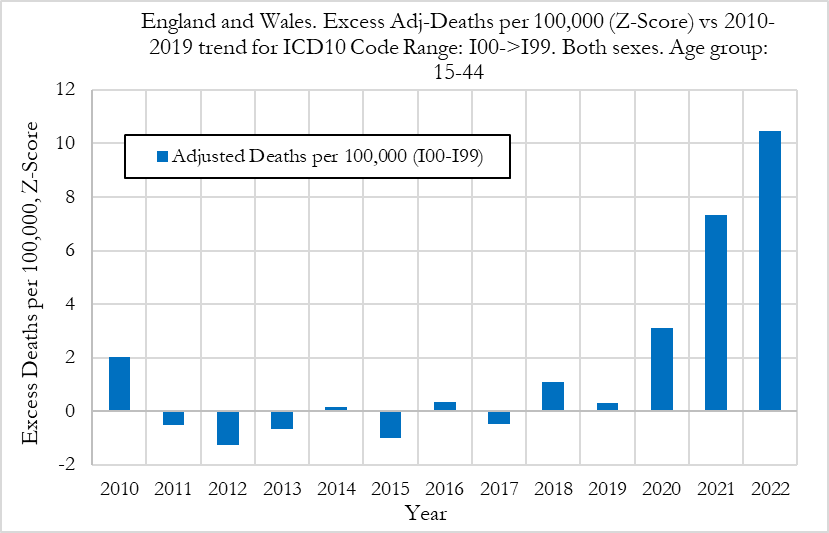
In Figure below (left) we can observe that the excess deaths rates from cardiovascular diseases rose by about 13% in 2020, 30% in 2021 and about 44% in 2022. On the other hand, the excess mortality for all registered deaths UK was about 5% in 2020, 15% in 2021 and 10% in 2022. The drop in excess mortality for all registered deaths from 2021 to 2022 was not mirrored in a drop in cardiovascular deaths. The opposite occurred, with a sharp acceleration in excess deaths due to cardiovascular diseases.
When looking at excess deaths for cardiovascular diseases, the Z-score in 2020 was around 3, indicating that prior to the start of the vaccinations there was already a signal pointing to an increase in cardiovascular deaths. That trend however accelerated substantially in 2021 and 2022 where we observe Z-scores of around 7.5 and 10.5, respectively. These are extreme events that we believe need a thorough investigation.
Summary:
-
Our analysis shows that the excess death rates from cardiovascular diseases rose by about 13% in 2020, 30% in 2021, and about 44% in 2022.
-
The excess mortality from cardiovascular deaths in 2021 and 2022 are highly statistically significant with Z-scores of 7.5 and 10.5, respectively. These are very strong signals.
-
These signals are corroborated by similar findings when measuring rises in the fraction of deaths from cardiovascular diseases relative to all other deaths with classified causes (see full report above).
Analysis of Excess Adjusted Death Rates from Cardiovascular Diseases for Males and Females
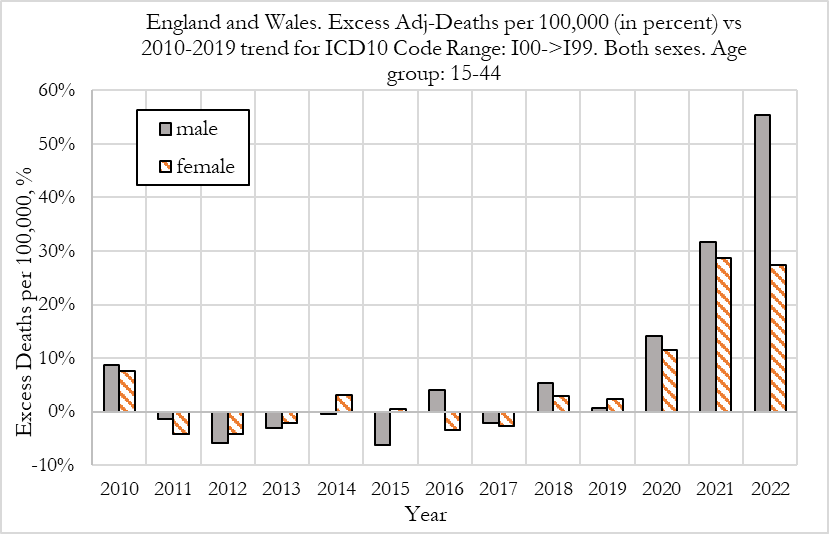
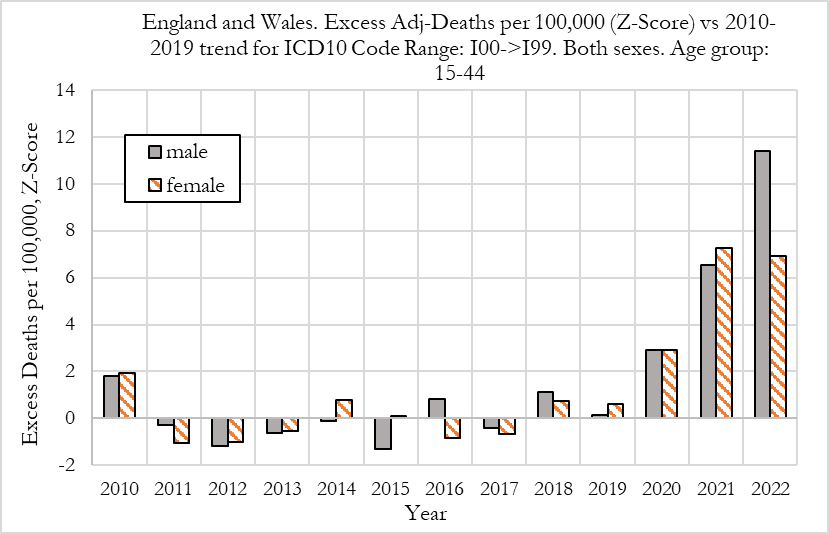
We now compare excess deaths rates from cardiovascular diseases for males and females aged 15-44, as shown in the Figure below.
When looking at deaths attributed to the circulatory system for males and females, shown in the figure below, we observe that in 2020 and 2021 both had similar outcomes in excess mortality (deviation from trend) as well as the respective Z-scores (statistical significance). However, we also observe that in 2022 men suffered much worse outcomes than women, with men experiencing a 56% deviation from trend, compared to about 28% for women.
Summary:
-
When comparing outcomes for men and women, we observe that they had similar rises in deaths from cardiovascular diseases in 2020 and 2021.
-
However, in 2022, men suffered much worse outcomes than women, with men experiencing a 56% deviation from trend, compared to about 28% for women.
-
Further investigation is needed. We speculate that one of the factors contributing to this difference may be men doing more physical exercise than women, which increases the probability of fatal outcomes, once the heart muscle has suffered prior (mild) injury.
Excess Disability PIP Clearances for new Claims from Cardiovascular Diseases
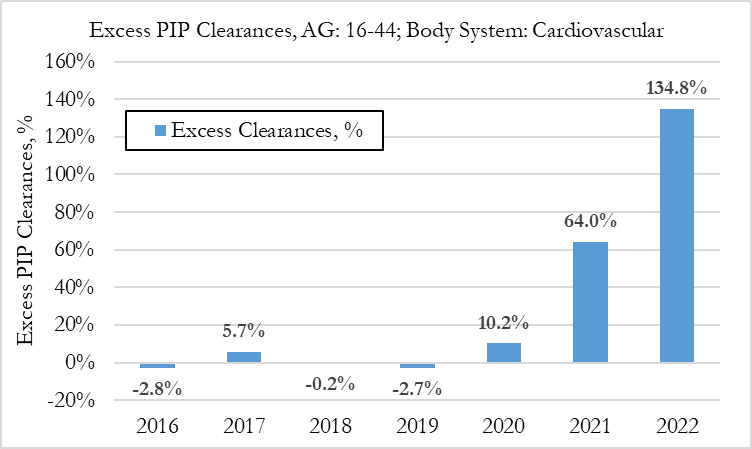
The figure below shows excess yearly clearances for new claims to the Personal Independence Payment (PIP) system in the UK for the cardiovascular system for ages 16 to 44, relative to the 2016 to 2019 average number of new claims.
Summary:
-
In 2020 PIP claims increased by about 10%, which was a slight increase from the 2016-2019 average. In 2021
however, PIP clearances increased by 64% and in 2022 by about 135%, relative to the baseline.
-
In terms of absolute numbers, in 2020, cardiovascular disability claims were about 2200, 100 more than the prior 5-year average. In 2021, there were about 3600 disability claims (1500 more than the 2015-2019 average) and in 2022, 5100 (3000 more than the 2015-2019 average).
-
As we've previously shown, these values have a high statistical significance, as can be observed On our website, where present the analysis of trends in PIP clearances for the different body systems which include interactive charts where the user/researcher can change body system, age of the individuals and trend metric.
Conclusions

-
The results shown in table above indicate that there was a significant rise in both disability claims and deaths in the 15-44 age group in the UK.
-
We observe that there was a 6.6 per 100,000 excess rate of disability claims, and only a rate of 2.2 per 100,000 excess deaths in 2021. These rates rose in 2022 with 13.2 per 100,000 disability claims and 3.08 per 100,000 excess deaths. This compares with a baseline pool of possible injured individuals of 2,800 per 100,000 reported in the paper by Buergin et al.
-
We also observe that the relative changes in disabilities were more than double the equivalent rises in deaths, which points towards the risk of higher cardiovascular deaths in the coming years as these conditions remain unresolved.
-
The observations above point to a worrying picture that we might see an even greater acceleration of cardiovascular deaths and disabilities in the coming years, which makes the investigation of the underlying causes of upmost importance.
-
We are currently in the process of pursuing further investigations into this issue in more detail. In particular, we aim to analyse the trends in deaths and disabilities for the most common individual ICD10 causes within the circulatory system, in order to have insights into the underlying phenomenon of action.


